
Introduction: Why Reading the Market Matters

How to Read the Market: 7 Technical Indicators Every Trader Should Know is more than a catchy phrase — it’s the foundation of profitable trading. Whether you’re analyzing the Nifty 50, Dow Jones, or crypto charts, understanding how to interpret market signals separates disciplined traders from emotional ones.
Market behavior often looks chaotic, but technical indicators help reveal its rhythm. They turn complex price movements into data-driven insights. In essence, learning how to read the market gives you the confidence to make informed decisions, rather than reacting to noise.
What Are Technical Indicators?
Technical indicators are mathematical calculations derived from price, volume, or open-interest data. They help traders identify entry and exit points, trend direction, and volatility.
There are two main types:
- Leading indicators (predictive) – hint at potential trend reversals.
- Lagging indicators (confirmative) – verify ongoing trends.
When used together, they offer a clear picture of market sentiment — essential if you truly want to read the market accurately.
How to Read the Market Using 7 Technical Indicators
Let’s explore the seven most trusted tools that every serious trader should master.
1️⃣ Moving Averages (MA)
Moving Averages smooth out price fluctuations, helping you see the underlying trend.
- Simple Moving Average (SMA) tracks the average closing price over a set period.
- Exponential Moving Average (EMA) gives more weight to recent data for faster reaction.
If prices stay above the moving average, it signals an uptrend; if they fall below, it hints at weakness.
Pro tip: Use the 50- and 200-day MAs together to spot “golden crosses” or “death crosses.”

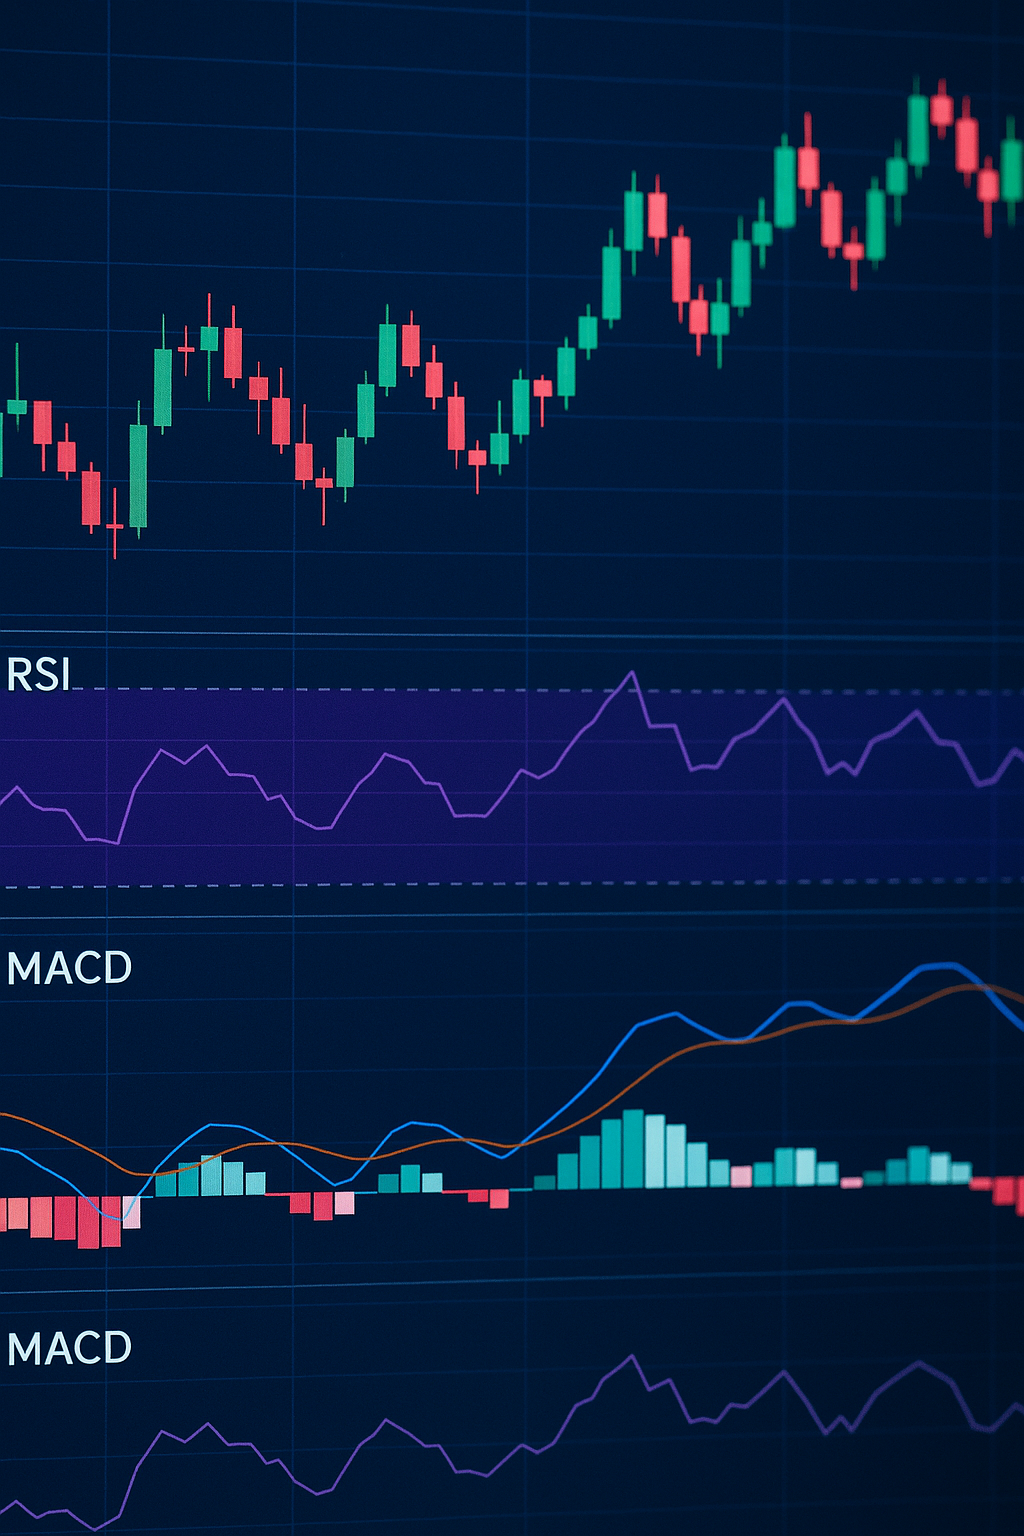
2️⃣ Relative Strength Index (RSI)
RSI measures momentum — how fast and strongly prices move. It ranges from 0 to 100:
- Above 70 = Overbought (possible sell signal)
- Below 30 = Oversold (possible buy signal)
Traders use RSI to spot reversals before they occur. It’s one of the most reliable tools when learning how to read the market.
3️⃣ Moving Average Convergence Divergence (MACD)
The MACD shows the relationship between two moving averages. It consists of:
- The MACD line (difference between 12- and 26-day EMAs)
- A Signal line (9-day EMA)
- A Histogram showing the difference between them
When the MACD line crosses above the signal line, it’s a bullish signal; below it, bearish. MACD helps identify trend momentum and reversals.
4️⃣ Bollinger Bands
Created by John Bollinger, these bands adjust to market volatility.
- The middle line = 20-day SMA
- Upper/Lower bands = ± 2 standard deviations from the SMA

When prices approach the upper band, the asset might be overbought. Touching the lower band suggests oversold conditions.
Tip: A “squeeze” (bands tightening) often predicts upcoming volatility.
5️⃣ Volume Indicators
Volume confirms price movement strength. A rising market with increasing volume shows conviction; falling volume may hint at fading momentum.
Key volume tools:
- On-Balance Volume (OBV) combines price and volume to confirm trends.
- Volume Rate of Change (VROC) reveals shifts in buying/selling pressure.
Volume analysis is crucial for reading breakout reliability — a must for anyone mastering how to read the market.
You may also like:
6️⃣ Fibonacci Retracement Levels
Based on the famous Fibonacci sequence, these levels identify potential support and resistance zones. Common ratios include 23.6%, 38.2%, 50%, and 61.8%.
Traders draw Fibonacci levels after a strong move to anticipate where the market may retrace before continuing the trend.
It’s one of the most widely used tools for short-term correction analysis.
7️⃣ Average True Range (ATR)
ATR measures volatility by averaging true range values over a set period. A high ATR = high volatility; low = stable market.
Traders use it to set stop-loss and take-profit targets logically rather than emotionally. It doesn’t predict direction — it tells you how much the price can move.
Combining Indicators for Better Accuracy
No single tool guarantees success. Professionals use a combination to confirm signals.
For example:
- Use RSI + MACD to confirm reversals.
- Combine Moving Averages + Volume Indicators to validate breakouts.
The key to how to read the market effectively lies in understanding confluence — when multiple tools tell the same story.
Common Mistakes Traders Make
Even seasoned traders fall into traps:
- Overloading charts: Too many indicators cause confusion.
- Ignoring volume: Price movement without volume support can mislead.
- Skipping risk management: Technical tools are useless if you ignore stop-losses.
Avoid analysis paralysis — focus on two or three indicators that complement each other.
How Beginners Can Start Reading the Market
If you’re new, begin with simple setups:
- Plot a 50-day SMA to understand the main trend.
- Add RSI for momentum.
- Observe volume during key movements.
Track these for at least a month on demo charts before trading real money. Remember, mastering how to read the market is about consistency, not complexity.

Conclusion
Learning How to Read the Market: 7 Technical Indicators Every Trader Should Know gives you a structured edge in volatile markets. Each indicator acts like a lens — when combined, they create a clear image of where price might head next.
The more you study and practice, the sharper your intuition becomes. With patience, discipline, and a data-driven mindset, you’ll evolve from guessing trends to understanding them.
frequently asked questions
For new traders, start with Moving Averages, RSI, and MACD. They’re easy to interpret and effective for spotting basic trends and reversals.
Ideally, use 2–4 indicators that complement each other. Over-using indicators can create conflicting signals and confusion.
There’s no perfect tool, but Moving Averages and MACD combined provide a strong trend confirmation setup used by professional traders worldwide.
Yes. The same indicators—like RSI, MACD, and Bollinger Bands—work across all markets, as they’re based on price behavior, not the asset type.
Study one indicator at a time, back-test your setups, and follow reliable educational sites such as TradingView, Investopedia, etc.